LMS Dashboard: What Is It and How to Use One

Every training manager faces the challenge of proving the ROI of their programs to show that their initiatives are working. This means manually analyzing mountains of data and spending countless hours piecing together reports… that’s if they don’t have an LMS dashboard, of course.
In this article, we’ll examine what an LMS dashboard is, why you might need one, explore its essential components and best examples for 2026.
What Is an LMS Dashboard?
An LMS dashboard is the command center of your learning management system, serving as a visual hub where you can track, manage, and analyze everything related to your training programs — all in one place. Instead of sifting through different reports or switching between tools, the LMS dashboard provides a snapshot of key metrics and simplifies complex data into clear visuals, helping you make smarter, faster decisions about your training initiatives.
How Can You Benefit from an LMS Dashboard?
If you manage training programs, an LMS dashboard should be the first tab you look at after logging into your learning platform. Here are the three key benefits that make it an essential LMS feature:
Smart training administration
For training admins managing large-scale programs, keeping tabs on multiple students, groups, departments, branches, and courses, an LMS dashboard is a magic wand. It provides you with a bird’s-eye view of everything that’s going on in the organization.
Real-time training analytics, such as completion rates, enrollment statuses, and assessment scores, help you identify trends and outliers at a glance. If deeper insights are needed, you can easily drill down into specific teams, departments, or individual learner performance stats.
Streamlined progress tracking
With an LMS dashboard, you don’t need to dig through endless LMS menus to understand how training is progressing. Training managers can grasp the overall status of their programs within minutes.
Key metrics are presented in a clear, visual format, making it easy to assess progress. Whether you’re preparing for a meeting or simply checking on overall progress, this saves you countless hours you would otherwise spend searching for information or compiling data manually.
Timely decision-making
Quickly generated visuals on learning stats allow you to spot underperforming branches or training materials that consistently cause learner bottlenecks and link training metrics with business outcomes. By having all this information at your fingertips, you can dig deeper, see the causes, and make faster, more strategic business decisions, such as reallocating resources, making a content improvement to achieve better course efficiency, or reaching out to learners who are falling behind.
The Key LMS Dashboard Components
An LMS dashboard is only as good as the features it offers. And since they aren’t designed the same, you should know what a great LMS dashboard should include to provide true value to you as a learning administrator.
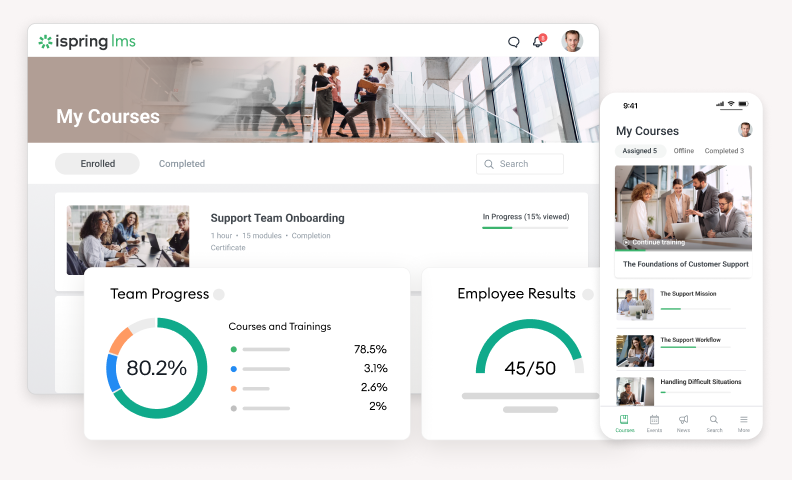
Dashboard of the iSpring LMS training platform
Let’s explore what features a good dashboard includes using the iSpring LMS as an example — an online learning management system known for its comprehensive LMS reporting features and user-friendly interface.

1. Smart filters for quick insights
First, a good LMS dashboard lets training instructors filter information to quickly pinpoint specific data by group, department, or course. It will allow you to monitor progress, analyze performance, and access actionable metrics without wasting time on irrelevant information.
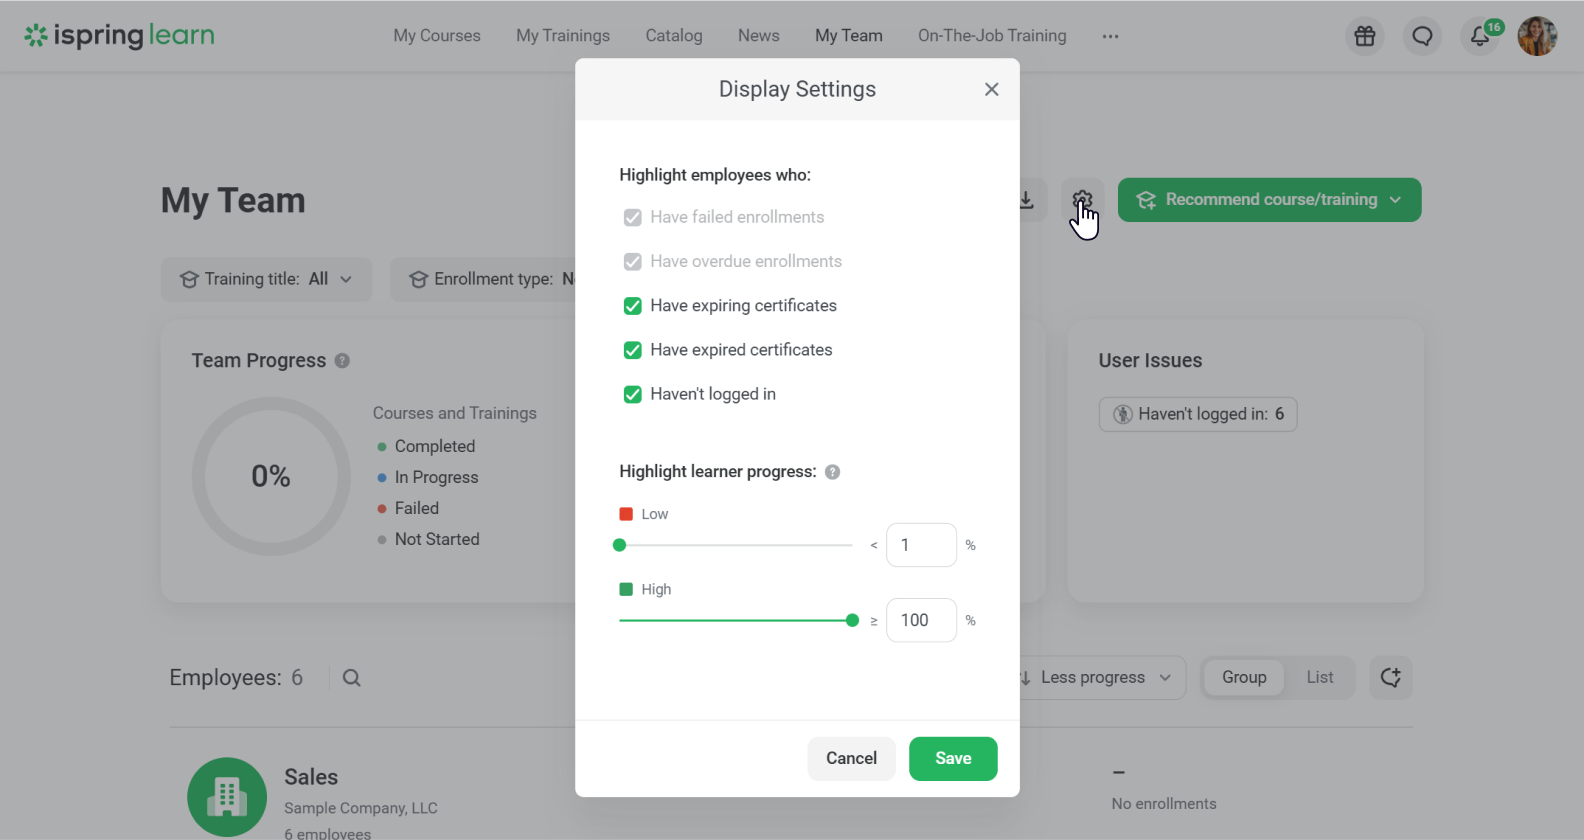
In the screen, you can see what iSpring LMS offers to narrow down the data, including a calendar that allows you to display learning statistics by a specific date, making it easy to track progress within a particular time frame.

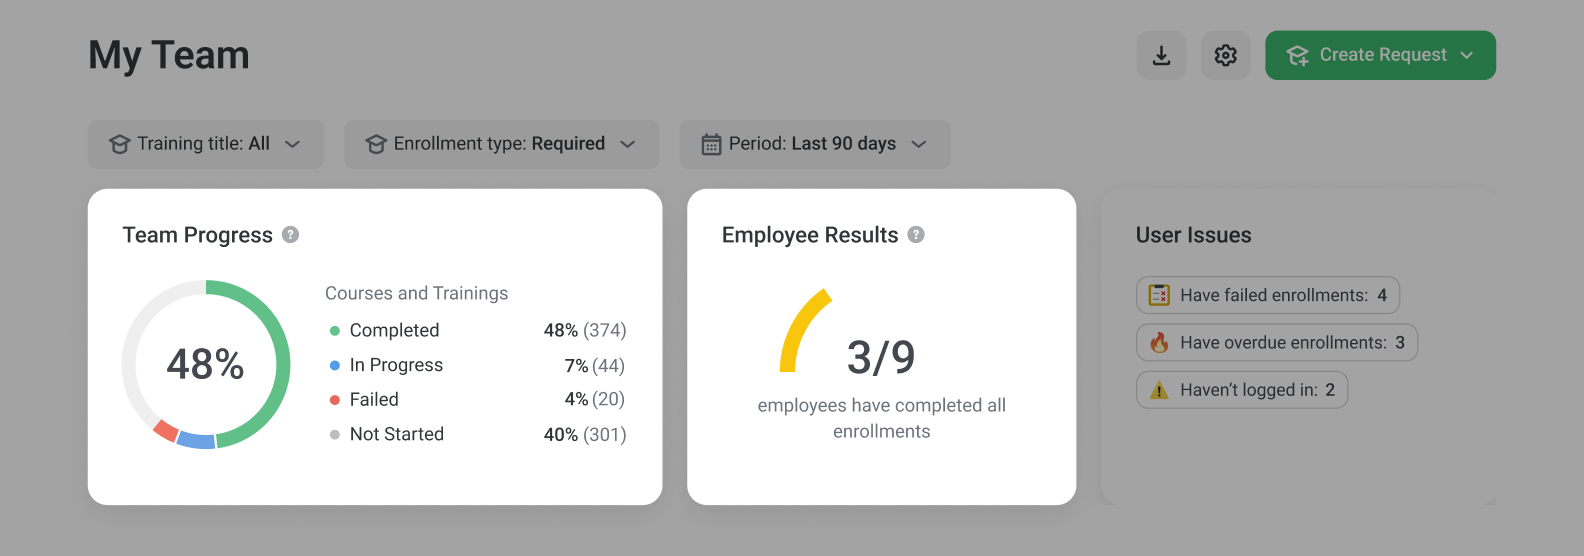
2. An overview of learner progress
This is a high-level summary, including completion rates for online courses and programs, in-progress materials, and overdue tasks. This big-picture view helps you measure overall program success, and ensure that learners are staying on track.
3. Performance barriers
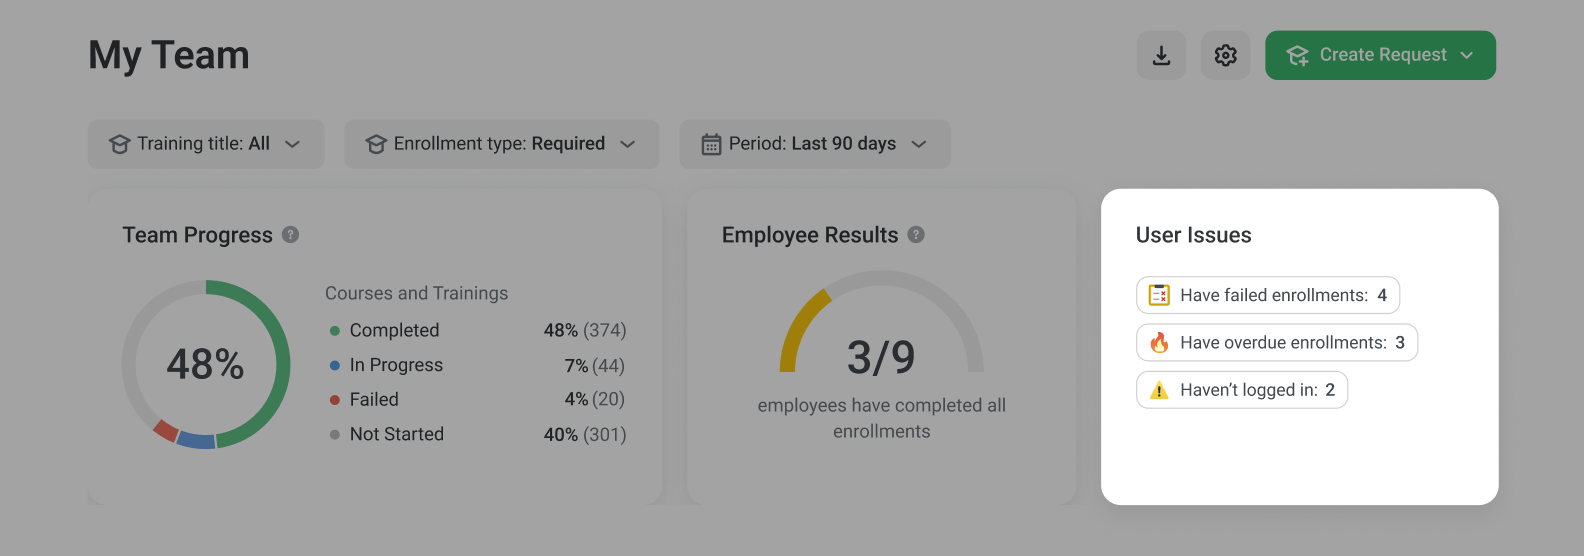
Your supervisor dashboard should help you quickly spot obstacles that hinder training progress. For example, the iSpring learning management system highlights user issues such as failed enrollments, overdue courses, expired certifications, and inactive learners. These insights allow you to take immediate action and address gaps before they impact overall program success.
4. Learner activity and engagement
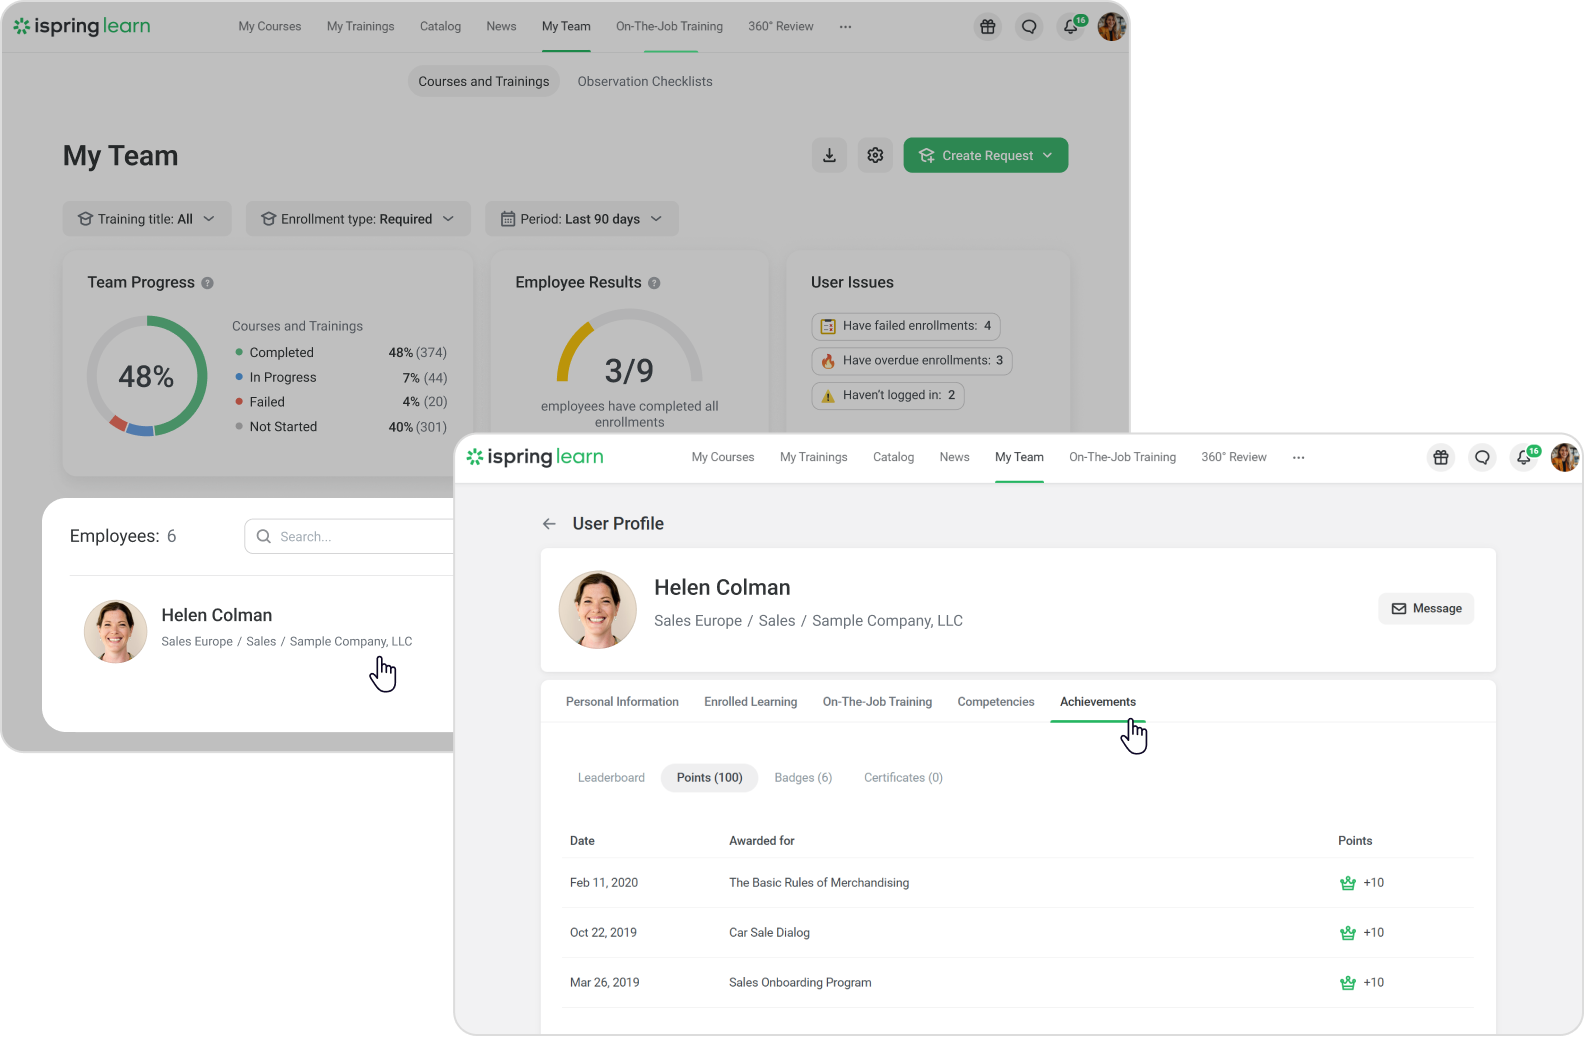
An LMS analytics dashboard shouldn’t stop at providing an overview — it should allow you to dive deeper into individual learner data. For example, click on any user to drill down into their personal learning results, such as enrolled courses, awarded points, badges, and certificates (gamification metrics), and the last time they logged into the system (last session). This helps to gauge the online learning experience and student engagement, show when students encounter some hurdles, and provide targeted support to those who might be falling behind.
These are the must-have elements of a good LMS dashboard. Some other useful functionalities can be showing the number of active users per month, the most popular online courses, stats about learning paths and virtual classroom sessions, upcoming events, top-performing learners, and detailed comparisons across departments or branches.
An advanced platform also allows you to edit the widgets (customize the LMS dashboard design). Such customization helps LMS administrators display only the main metrics that are relevant to your learning goals.
3 More Examples of Comprehensive LMS Dashboards
Discover three more LMS dashboard examples of good online learning platforms that, like iSpring LMS, set a high standard of learning analytics by providing all the tools administrators need to easily manage and track learning programs:
1. EducateMe
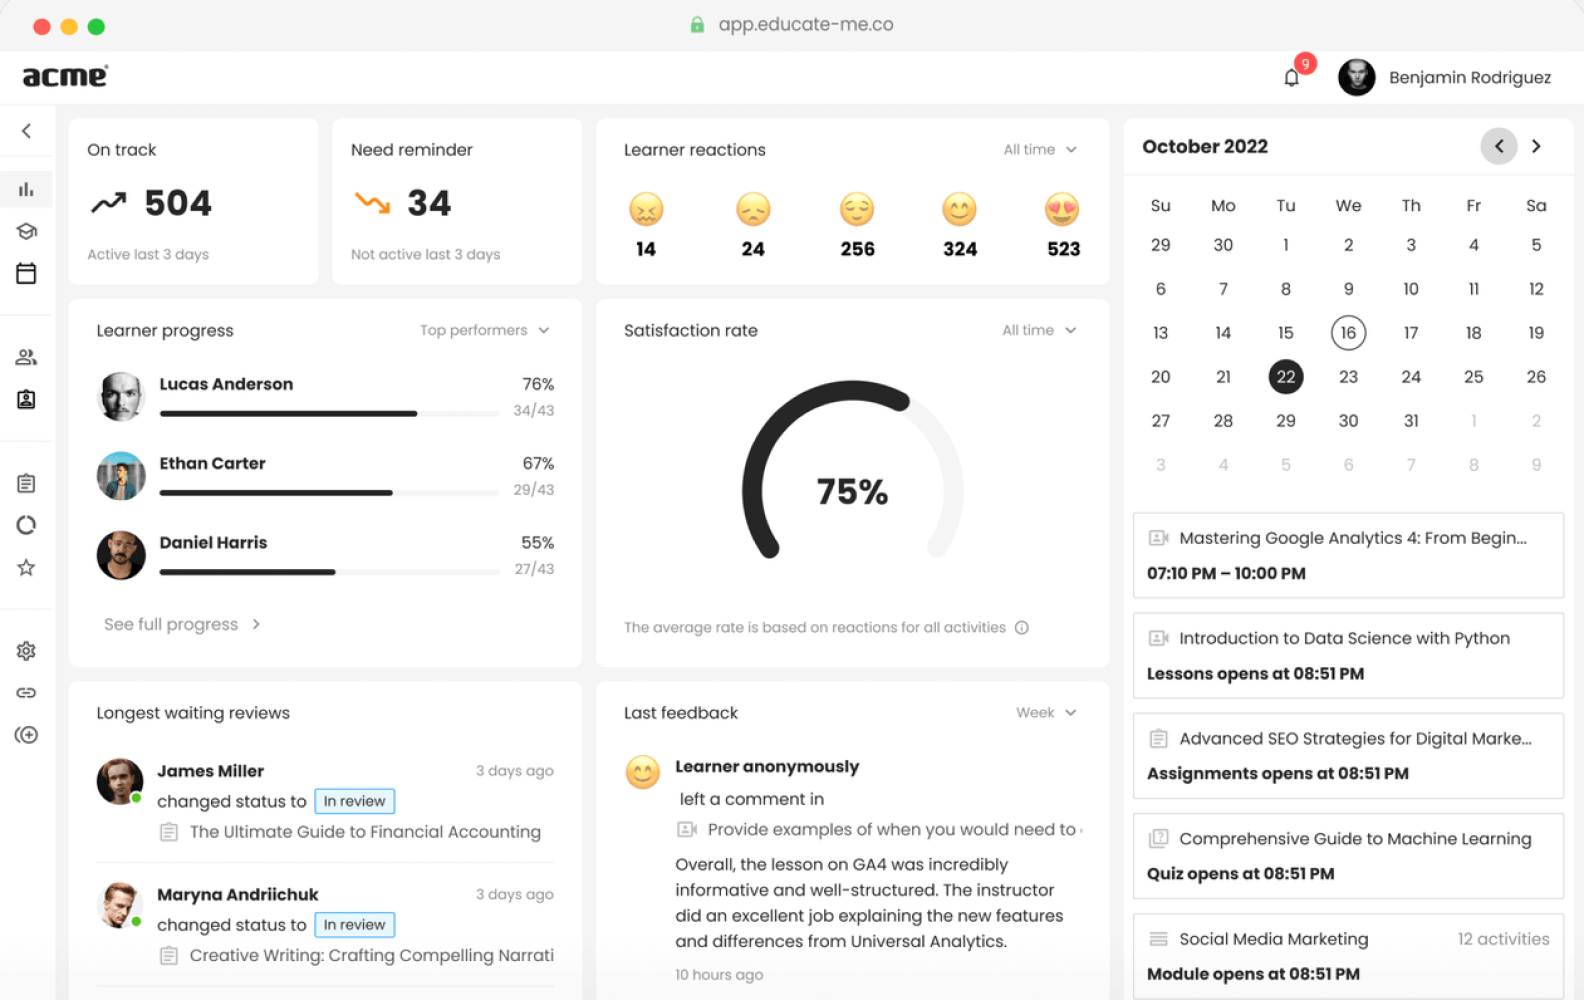
EducateMe is a robust learning management system that features in-depth training analytics and a data-rich LMS admin dashboard. Besides standard widgets that show learner progress — the students who are on track or need reminders — in the image, there’s a snapshot of how users feel about their learning, with a breakdown of emojis representing different sentiments.
Combined with user feedback, where individual comments are visible, as well as longest waiting reviews that track outstanding tasks, this LMS dashboard offers plenty of insights into the effectiveness of learning programs.
2. 360Learning
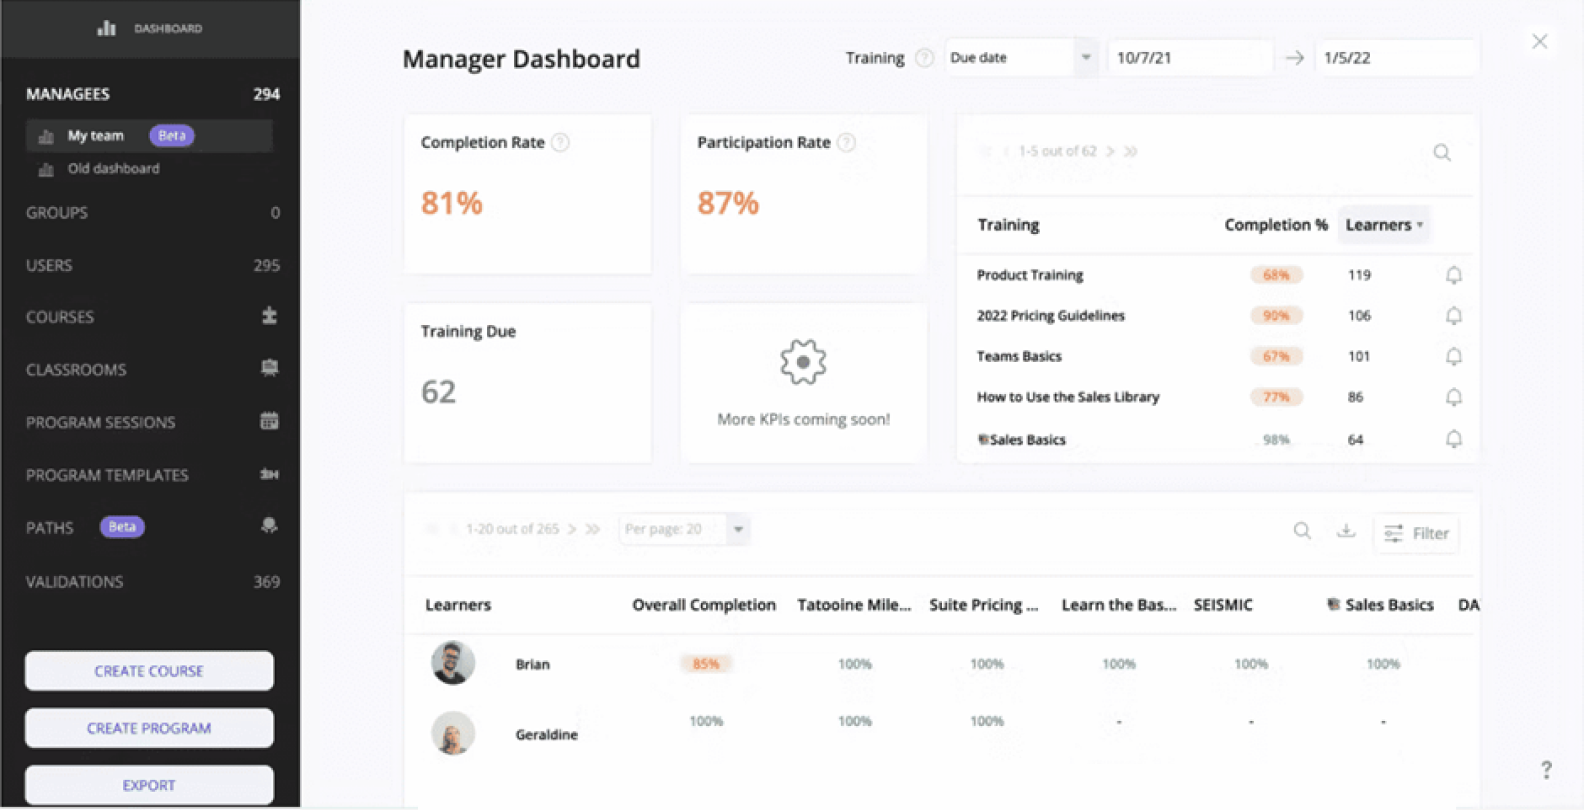
360Learning is a collaborative learning management system with a dashboard that places actionable data front and center. Essential metrics like Completion Rate, Participation Rate, and Training Due provide a quick overview of learning performance, enabling managers to identify trends and areas needing attention. The LMS dashboard UI is clean and minimalistic, which makes the learning experience very intuitive.
3. TalentLMS
.png)
TalentLMS is a comprehensive and user-friendly learning management system for both online and blended learning programs. Its LMS dashboard stands out with a Quick Actions panel, letting admins add users, online courses, and groups in seconds without leaving the control center.
The Timeline feature provides real-time activity updates, like logins and course changes, offering context of the latest changes on the platform at a glance. Combined with a clear overview of active users, training time, and completed courses, TalentLMS keeps training management efficient and intuitive.
Conclusion
As you can see, LMS reporting, and particularly a comprehensive LMS dashboard, is an essential feature you should keep in mind when searching for a learning platform for your organization. Prioritize solutions with dashboards that provide actionable insights, intuitive navigation, and the tools you need to meet your organization’s goals.


